Posted by admin on June 29, 2009 under Articles | 
DBSV portfolio in the past 3 months
Few potential counters like Pacific Andes, Banyan Tree, Mermaid Maritime, Swissco International, China Sports International & China Fishery Group
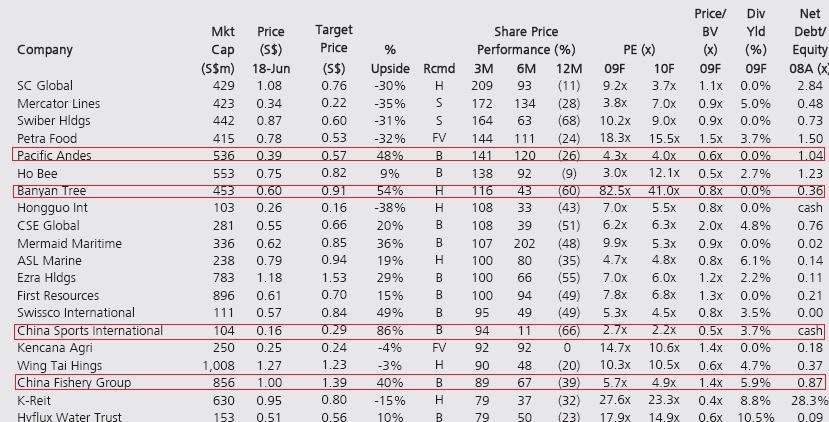
Read full Top 20 Best Performing Small / Mid Cap Stocks
Posted by admin on June 27, 2009 under Articles |
STI will be trying to charge out of the yellow downtrend channel in the next few hrs…
This downtrend channel breakout will trigger the shortists to scramble for short covering…power repair by the BBs for window dressing…
Nearest resistance is the cyan trendline and midas line at 2350~2365 zone….
Read the full story at : http://www.rmao.net/forum/viewtopic.php?f=2&t=209&start=210
Posted by admin on under Articles |
Opening Price Theory and Trading Timings
HAd been a while after those losses..Studied a real bit on price movements intraday and spotted a few pointers we can rely on.
1. Try not to trade between 0900 – 0930. Study if prices holds above OP after 0930 and sustainable till 1015 – 1030. If below OP..weakness on stock. If price holds well above OP throughout the day. Most likely it will lead..
2. Try not to buy between 1130 – 1230.
With that, I reverse abit of previous loss on Kepland. Shorted it at 2.35 and covered at 2.21 followed by long at 2.26 which was bad timing but I did not hastily cut loss this time but I held on seeing another upwave..luckily for me it did realised and I escaped at 2.29.
With the OP theory, sensed weakness in stocks. CapitalLand was trading below OP today and executed a quick short at 3.80, to see the price break down. Covered at 3.75. I should have held on but worried of the window dressing effect.
Coupled with timing in entries, monitoring of price movements and opening price on day when you need to execute a trade. + TA of the charts the day before. It could make our trades more timely.
The strong reversal before dive…
Kepland was strong on 25/06. big white candle up like 12 cents with large volumes. I seen this senario 3rd time. twice in Kepland and once in SPH. Prices have been falling or trading in tight ranges and suddenly reversal formed which looks strong. After that day, price will still be trading at that range for another 1-2 days before it goes back to dormant stage…after that it will go down trend.
This is just an observation. Kepland and Capitaland made many happy on 25/06. Today, weakness showed in this counters instead of showing another white candle which was evident in the previous reversals instead we see a small black candle. or a star. Its for us to judge next week.
These are just my observations and it may not always hold in various market situations.
by kkworks, http://www.rmao.net/forum/viewtopic.php?f=2&t=369
Posted by admin on June 14, 2009 under Articles |
by ….
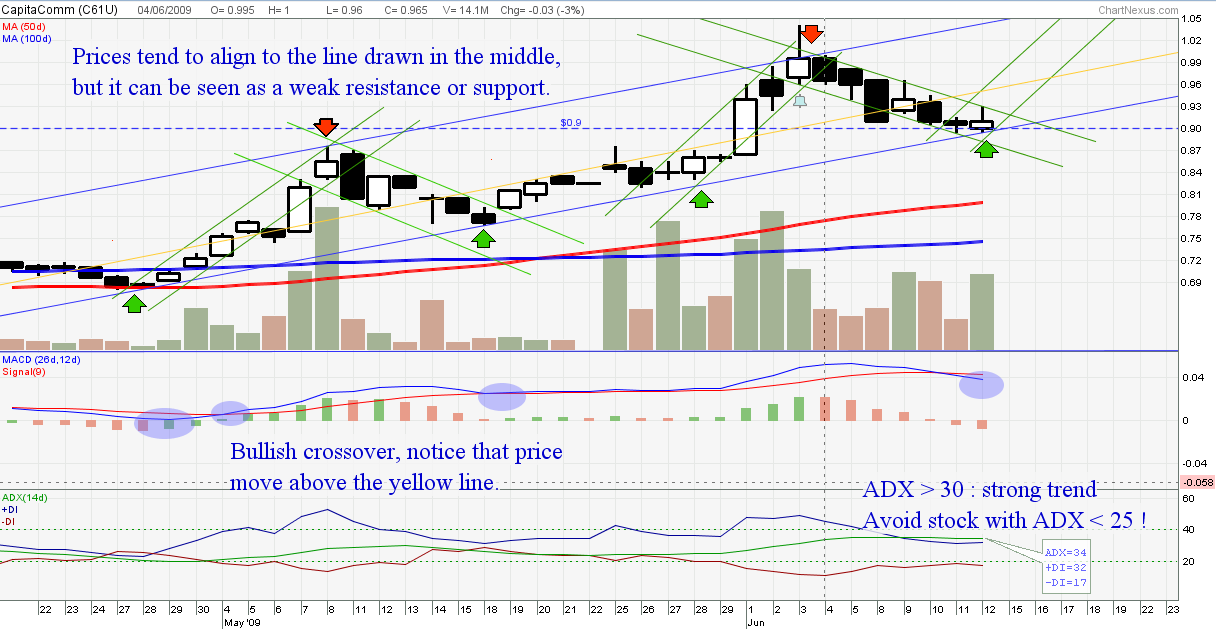
CapitaComm
Posted by admin on under Articles |
STI 2377.07 -4.74 -0.2% 2397.57 2364.21 16:59:45
Hangseng 18889.68 98.65 0.52% 19161.97 18707.19 16:01:32
Nikkei225 10135.82 154.49 1.55% 10170.82 10050.96 15:00:41
SSE 2743.76 -53.56 -1.91% 2812.68 2722.22 15:00:20
KLCI 1090.15 1.19 0.11% 1095.91 1089.19 16:51:01
SET 628.55 1.48 0.24% 638.05 623.98 16:40:08
FTSE100 4441.95 -19.92 -0.45% 4471.95 4427.24 16:29:46
DAX 5069.24 -38.02 -0.74% 5108.77 5044.33 17:35:30
CAC 3326.14 -8.80 -0.26% 3340.50 3310.52 18:35:16
Dow 8799.26 28.34 0.32% 8805.53 8716.73 16:04:23
NASDAQ 1858.80 6.37 0.34% 1858.80 1833.39 16:00:16
S&P500 946.21 1.32 0.14% 946.30 935.66 16:04:37
World Stock Indices – Jun 2009
Posted by admin on June 12, 2009 under Articles |
Neptune Orient lines covered a gap up at 1.55 retracement, which rebounds off it, stochastic signals that NOl has enough resting, it could breakout of recent high at 1.79 if stochs and candles decides to reverse up at a frightening volume, volume is the critical element of NOl if it has to breakout, 1.55 worth a 2nd look if retracement took place again, but never rule out possibilities of NOL going lower if 1.55 breaks…all boil downs to experience
NOL Technical Analysis
Posted by admin on under Articles |
Still bounded by the hourly short-term downtrend parallel channel at the moment…
The critical zone of 2380~2402 is something to look out for today…
Also note that last friday’s closing is 2396, an important magic number to clear by today for a nice weekly candlestick…
Cinderella’s Trading Room