STI – Hourly & Daily Chart
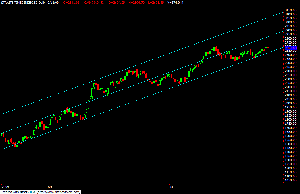
STI Daily Chart

A peep at the major trendline channels…still safely above major uptrend line
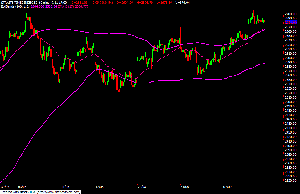
STI Hourly Chart

Still staying safely above the hourly upper bollinger band at 2665…
Continue to watch closely how STI stays above the hourly upper bollinger band next week…
By Cinderella – STI Charts


william said,
<a href="http://notarius.artistboss.ru/?p=23&lol= henris@hearest.winter” rel=”nofollow”>.…
ñïàñèáî….
Ernest said,
<a href="http://jesss.songkeeper.ru/?p=29&lol= suspicious@oman.obliterated” rel=”nofollow”>.…
ñïñ!!…
Hubert said,
<a href="http://net.artistical.ru/?p=29&lol= projectiles@ryusenji.straits” rel=”nofollow”>.…
ñýíêñ çà èíôó….
Add A Comment